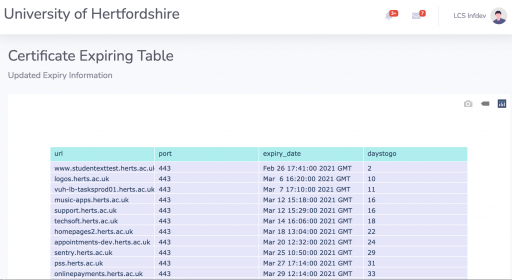
In another post I wrote a script to interrogate a list of websites and their port to bring back their expiry date and calculate the number of days to go before expiring. It can produce a file like this:
helpdesk.example.com,443,Feb 26 17:25:00 2021 GMT,3
exttest.example.com,443,Feb 26 17:41:00 2021 GMT,3
mac-update.herts.ac.uk,443 ,Feb 27 16:48:00 2021 GMT,4
api.herts.ac.uk,443 ,Feb 28 12:03:00 2021 GMT,5
logos.example.com,443,Mar  6 16:20:00 2021 GMT,11
Well if we want to display that on a dashboard or website.
#!/usr/bin//env python3
import sys
import re
import csv
from datetime import datetime, date,timedelta
from operator import itemgetter
import pandas as pd
import plotly.express as px
import plotly.graph_objects as go
websites = []
sorted_websites = []
with open('results.txt') as csvDataFile:
csvReader = csv.reader(csvDataFile)
for row in csvReader:
websites.append( { "url": row[0], \
"port": row[1], \
"expiry_date": row[2], \
"daystogo": int(row[3]), } )
for website in sorted(websites, key=itemgetter('daystogo')):
#print("%40s:%-4s \'%-30s\' %3s " % ( website['url'], website['port'], website['expiry_date'], website['daystogo']))
sorted_websites.append( { "url":website['url'], "port":website['port'], "expiry_date":website['expiry_date'], "daystogo":website['daystogo'] } )
# Creates DataFrame.
df = pd.DataFrame(sorted_websites)
df = df.query(' daystogo < 15 and daystogo > -1 ')
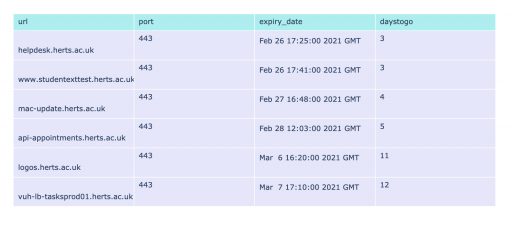
fig = go.Figure(data=[go.Table(
header=dict(values=list(df.columns),
fill_color='paleturquoise',
align='left'),
cells=dict(values=[df.url, df.port, df.expiry_date, df.daystogo],
fill_color='lavender',
align='left'))
])
fig.show()
sys.exit()With a little more work you can display it in a website and have it update daily: