
Well you can achieve alot from a little code.
import geopandas
import geoplot
world = geopandas.read_file(geopandas.datasets.get_path('naturalearth_lowres'))
world.boundary.plot();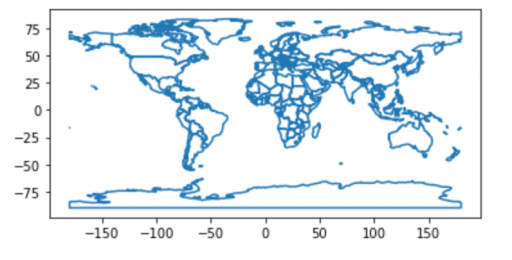
import geopandas as gpd
import geoplot
world = gpd.read_file(gpd.datasets.get_path('naturalearth_lowres'))
uk =  world[world.name == "United Kingdom"]
uk.boundary.plot();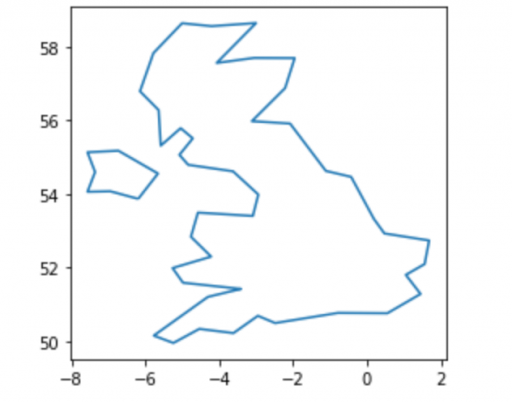
OK that was exciting enough but it can quickly get better. This is nothing clever from me, this is an example from matplotlib.org
#!/usr/bin/env python3
import numpy as np
from mpl_toolkits.basemap import Basemap
import matplotlib.pyplot as plt
from datetime import datetime
map = Basemap(projection='mill',lon_0=180)
map.drawcoastlines()
map.drawparallels(np.arange(-90,90,30),labels=[1,0,0,0])
map.drawmeridians(np.arange(map.lonmin,map.lonmax+30,60),labels=[0,0,0,1])
# fill continents 'coral' (with zorder=0), color wet areas 'aqua'
map.drawmapboundary(fill_color='aqua')
map.fillcontinents(color='coral',lake_color='aqua')
date = datetime.utcnow()
CS=map.nightshade(date)
plt.title('Day/Night Map for %s (UTC)' % date.strftime("%d %b %Y %H:%M:%S"))
plt.show()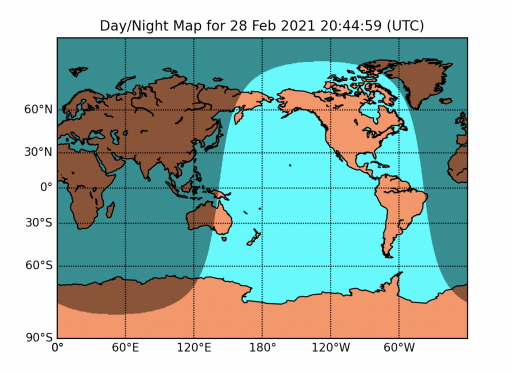
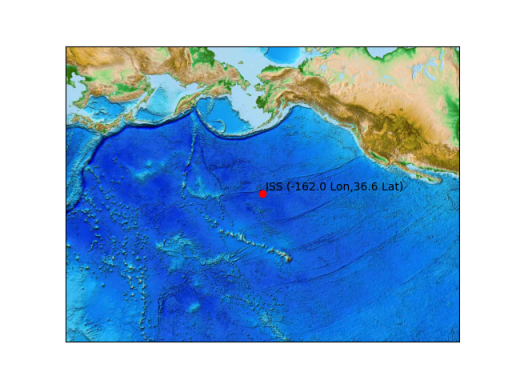
I combined two examples I found. One to get the co-ordinates of the International Space Station, and one which plots a section of the world based on co-ordinates.
#!/usr/bin//env python3
from mpl_toolkits.basemap import Basemap
import matplotlib.pyplot as plt
import requests
import time
from math import *
iss_lat = iss_lan = 0

def get_iss_position():
    # Get current ISS position
    req_iss = requests.get('http://api.open-notify.org/iss-now.json')
    dict = req_iss.json()
    lat_lng = dict['iss_position']
    # save the current ISS  possition in new variables
    lat_iss = float(lat_lng['latitude'])
    lng_iss = float(lat_lng['longitude'])
    return lat_iss, lng_iss

iss_lat, iss_lon = get_iss_position()
m = Basemap(width=12000000,height=9000000,projection='lcc',
	 resolution=None,lat_1=45.,lat_2=55,lat_0=iss_lat,lon_0=iss_lon)
xpt, ypt = m(iss_lon, iss_lat)
m.plot(xpt,ypt, 'ro')
plt.text(xpt+100000,ypt+100000,'ISS (%5.1f Lon,%3.1f Lat)' % (iss_lon,iss_lat))
m.etopo()
plt.show()
OK how can this be turned to add value to System Administration? Well we could plot the location of IP’s coming into our websites.