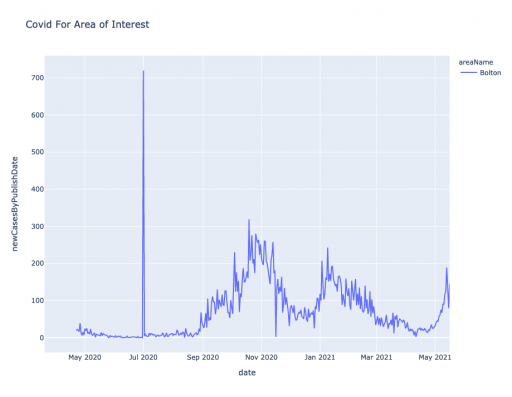
So it’s mid May 2021 and the town of Bolton has sharply rising numbers of infected people. As I came to graph this I noticed there is a Python SDK library (April 22 2021) called uk-covid19 . So using the examples Public Health England provide, the simplest program I can come using lovely pandas dataframe and plotly is:
from uk_covid19 import Cov19API
import plotly.express as px

bolton_area = [ "areaType=ltla", "areaName=Bolton"  ]

cases_and_deaths = {
    "date": "date",
    "areaName": "areaName",
    "newCasesByPublishDate": "newCasesByPublishDate",
    "newDeaths28DaysByDeathDate": "newDeaths28DaysByDeathDate",
}


api = Cov19API(
    filters=bolton_area,
    structure=cases_and_deaths
)

df = api.get_dataframe()

fig =  px.line(df, x = 'date', y = 'newCasesByPublishDate', title='Covid For Area of Interest',  color='areaName',\
         hover_name = 'areaName', )
fig.show()