The musings of an amateur pythonista. OK Guy Lipman really is the supermo on all things Octopus. Please check his posts if your interest is piqued.
import sys
import requests
import json
import pandas as pd
import plotly.express as px
energy="electricity"
#energy="gas"
api_token= "sk_live_******************"
if energy == "electricity":
meter= mpan = "10*************"
serial = "21*********"
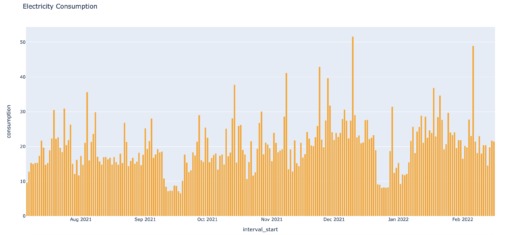
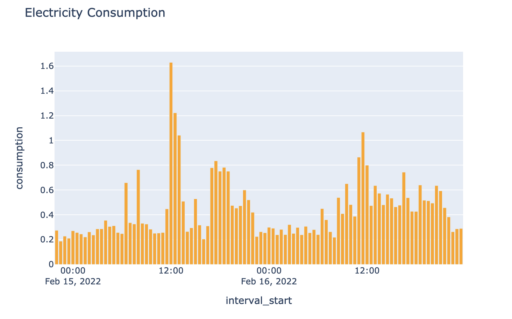
color="orange"
title="Electricity Consumption"
if energy == "gas":
meter= mprn = "74********"
serial = "E6*************"
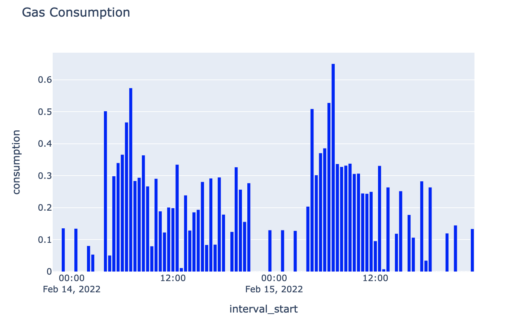
color="blue"
title="Gas Consumption"
url = "https://api.octopus.energy/v1/" + energy + "-meter-points/" + meter + "/meters/" + serial + "/consumption/"
response = requests.get(url, auth=( api_token, ""))
response_json = response.json()
results = response_json["results"]
df = pd.DataFrame (results)
fig = px.bar(df,
x='interval_start', y='consumption',
color_discrete_sequence =[color]*len(df),
title=title,
)
fig.show()
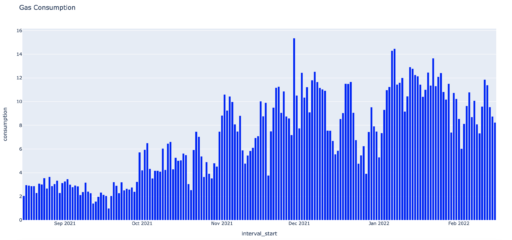
period_from="2021-06-01T00:00:00Z"
period_to="2022-02-17T21:00:00Z"
page_size="5000"
group_by="day"
url =  "https://api.octopus.energy/v1/" + energy + "-meter-points/" + meter + "/meters/" + serial + "/consumption/" + "?period_from=" + period_from + "&period_to=" + period_to + '&page_size=' + page_size + '&group_by=' + group_by