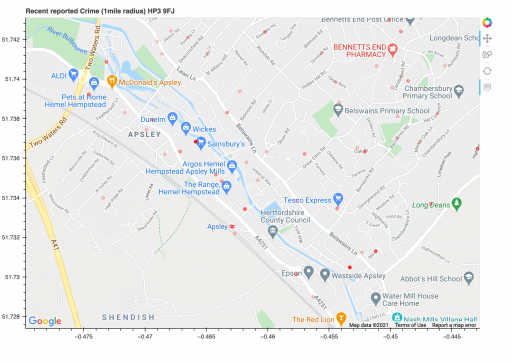
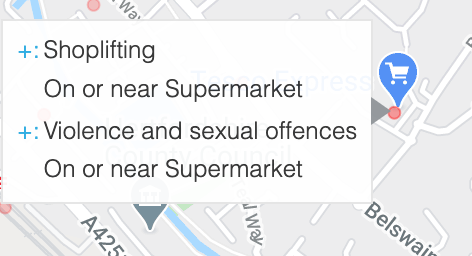
The map above is a heat map. So the red dots get deeper shade of red if there are more crimes in that area. There is hover points if you move the mouse over them.
#!/usr/bin/env python3
from bokeh.io import show
from bokeh.plotting import gmap, figure
from bokeh.models import GMapOptions, ColumnDataSource, HoverTool
import sys
import pandas
import csv
from police_api import PoliceAPI
from police_api.neighbourhoods import Neighbourhood
from police_api.forces import Force
from flask import Markup

CRIMFILE="heatmap.csv"
title='Recent reported Crime (1mile radius) ABC 123'
lat,lng=51.73525,-0.46124

''' Get the Crimelist based on that location '''
api = PoliceAPI()
import csv
with open(CRIMFILE, mode='w') as csv_file:
  csv_writer = csv.writer(csv_file, delimiter=',', quotechar='"', quoting=csv.QUOTE_MINIMAL)
  csv_writer.writerow(['Date', 'Category', 'Location','Outcome','Longitude', 'Latitude'])
  crimlist = api.get_crimes_point(lat,lng)
  for crime in crimlist:
      csv_writer.writerow([crime.month, str(crime.category).replace("<CrimeCategory>",""), crime.location.name,
         str(crime.outcome_status).replace("<CrimeOutcome>",""),crime.location.longitude, crime.location.latitude])


''' Now think about plotting them in a Google Map '''
bokeh_width=940
bokeh_height=640
def plot(lat, lng, zoom=15, map_type='roadmap'):
    api_key='XXXX yeah right get yer own        '
    gmap_options = GMapOptions(lat=lat, lng=lng,
                               map_type=map_type, zoom=zoom)
    p = gmap(api_key, gmap_options, title=title,
             width=bokeh_width, height=bokeh_height,
	     tools=[hover, 'reset', 'wheel_zoom', 'pan'])
    return p


df = pandas.read_csv(CRIMFILE)
hover = HoverTool(
        tooltips = [
            # @Category refers to the Category column
            # in the ColumnDataSource.
            ( "+", '@Category' ),
            ( "", '@Location' ),
        ]
       )

source = ColumnDataSource(df)
p = plot(lat,lng)
center = p.circle('Longitude', 'Latitude', size=6, alpha=0.2,
                      color='red', source=source )
show(p)