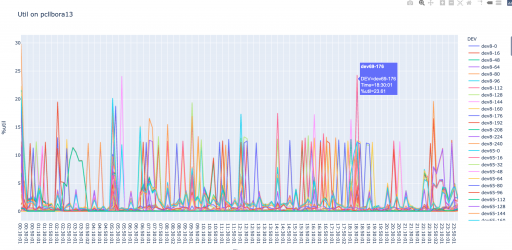
I use cacti to graph normally but with not all servers configured, how can I graph sar output with python. Well, using what I’ve learned recently, just convert the output to a csv file and pass it to a pandas dataframe.
#!/usr/bin/env python3
import sys
import requests
import pandas as pd
import csv
import plotly.express as px
import re

"""
This bit of fun is graph process the output of 'sar -f <safile> -d'
sar -f /var/log/sa/sa17 -d > /sar17.txt
"""

""" This Chunklet of code is merely to tidy up the .txt output.
    I'm going to delete the first two lines
    And substitute "Time" for "00:00:01" in the third line
    Before substituting commands for multiple spaces
"""
filename="sar17"
a_file = open(filename + ".txt", "r")
lines = a_file.readlines()
a_file.close()
lines[2]=lines[2].replace("00:00:01", "Time")
del lines[0]
del lines[0]
new_file = open(filename + ".csv", "w+")
for line in lines:
  line = re.sub(" +",",",line)
  new_file.write(line)
new_file.close()

df = pd.read_csv(filename + ".csv", delimiter=",")
fig =  px.line(df, x = 'Time', y = '%util', title='Disk Utilisation',  color='DEV', hover_name = 'DEV', )
fig.show()
sys.exit()
If you have KDE or X windows and firefox on your machine, you can display on the machine.
#!/usr/bin/env python3
import sys
import subprocess
import re
import pandas as pd
import csv
import plotly.express as px

# Ha first number of lines varies in sar output between nixes
# This one is for ubuntu
cmd="sar -d"
outfile="sar.csv"
output=subprocess.check_output(['sar','-d'],universal_newlines=True)
lines = output.split("\n")
for count in range(4): # delete 4 lines
 del lines[0]
# Change the column title on the Time column
lines[0]=re.sub("\d\d:\d\d:\d\d", "Time",lines[0])
new_file = open(outfile, "w+")
for line in lines:
 line = re.sub(" +",",",line)
 new_file.write(line  + "\n")
new_file.close()
df = pd.read_csv(outfile, delimiter=",")
fig =  px.line(df, x = 'Time', y = '%util', title='Disk Utilisation',  color='DEV', hover_name = 'DEV', )
fig.show()
sys.exit()


"""
numpy==1.20.1
pandas==1.2.2
pkg-resources==0.0.0
plotly==4.14.3
python-dateutil==2.8.1
pytz==2021.1
retrying==1.3.3
six==1.15.0